
Ubuntu Edge
It's finally here: The Ubuntu Phone!Well, almost...
Canonical anounced yesterday the Indiegogo campaign to fund the "commercial testbed for cutting-edge technologies" in the mobile industry: the production of the Ubuntu edge.
Initial funders could buy an ubuntu edge for $600, but limited to the first day and to 5000 funders. This first goal was reached rather quickly and now the phone costs $830. While the initial surge for the $600 edge suggested a rather high funding end-point, the pace has significantly slowed down after the first 5000 phones were sold. Let's hope the $32.000.000 can be reached in the 30 days period...
Update: Meanwhile Canonical offered several new reduced perks. While the "double edge" did not have a huge effect, the even newer and limited perks can be seen very clearly as different gradients in the funding curve.
Update2: Canonical has now also started the T-Shirt perk for $50. You can see the funding jump by zooming into 2013-07-30 11:30 UTC.
Below is a graph of the funding process. The trending line uses the last couple of datapoints to extrapolate (via a simple linear regression). Do not take this too seriously, since the typical behaviour of crowd-funding campaigns follows more complicated rules than a simple linear trend.
- Interaction: click-and-drag to pan, use the mousewheel to zoom, mouseover for a tooltip
- Updates: automatically updated every 3minutes
And since we all love graphs, here is one with the growth per hour...(sorry for the 1h data-gap, the bar surrounded by gaps is actually the sum of two hours):
What to do when you forgot the Django admin password on OpenShift
So, you created a django app on OpenShift, added some changes, push the changes, ... and forgot to note the admin password!What to do next?
It's actually quite easy:- ssh into your application
- start the virtual env:
source $OPENSHIFT_HOMEDIR/python/virtenv/bin/activate
- change to the app dir:
cd $OPENSHIFT_HOMEDIR/app-root/repo/wsgi/openshift/
- open the django shell:
python manage.py shell
- Reset the password:
from django.contrib.auth.models import User
u=User.objects.get(username__exact=’admin’)
u.set_password(‘whatever’);
u.save()
Qt5 Documentation
Is it just me, or is the Qt5 documentation really really hard to find?I tried to google for "QML PageStack" and no official documenation anywhere in the first pages. Then I directly went to the Qt site and tried to search there for Pagestack and guess what? The first link is a link to page where search results are given for the phrase "PageStack"! WTF?!
To make it short: there is no documentation for the QML element PageStack on the Qt pages. There is something in sailfish and something in the ubuntu-sdk pages...
I really don't get why it is so hard to make automatic documentation of all elements, which are then extended manually. At least the automatic docs would show a list of all properties, methods, signals, ... even if nothing else was written there, it would still help.
Dear Qt/QML developers, have a look at kivy to see how documentation is done. Cheers!
Calculating darktime with Python
Cherenkov telescopes like H.E.S.S. can only operate during darktime, that means when sun and moon are far enough below the horizon.To calculate the darktime for a night in Python, the fantastic ephem package can be used. "Far enough below the horizon" is achieved by setting the horizon to a negative value for the sun, e.g. -12 degrees.
#!/usr/bin/env python
# -*- Mode: Python; coding: utf-8; indent-tabs-mode: nil; tab-width: 4 -*-

import sys
import ephem

# create the observer
hess = ephem.Observer()
hess.lat = '-23.271333'
hess.long = '16.5'
hess.elevation = 1800
hess.date = ephem.Date(sys.argv[1] + " 12:00")

# calculate rising and setting times
darktime_start = []
darktime_end = []

# moon below horizon
moon = ephem.Moon()
moon.compute(hess)
if moon.alt < hess.horizon:
    darktime_start.append(hess.date)
    darktime_end.append(hess.next_rising(moon))
else:
    darktime_start.append(hess.next_setting(moon))
    darktime_end.append(hess.next_rising(moon))

# sun below -12 degrees
hess.horizon = "-12"
sun = ephem.Sun()
sun.compute(hess)
if sun.alt < hess.horizon:
    darktime_start.append(hess.date)
    darktime_end.append(hess.next_rising(sun))
else:
    darktime_start.append(hess.next_setting(sun))
    darktime_end.append(hess.next_rising(sun))

print "Darktime is from {0!s} UTC to {1!s} UTC".format(
    max(darktime_start), min(darktime_end))
With this code in a file "darktime.py", simply run:
> darktime.py 2013-01-31
Darktime is from 2013/1/31 18:35:36 UTC to 2013/1/31 19:29:22 UTC
Introduction to Python best practices in the sciences.
Starting with scientific programming in Python?
Triggered by a question from a colleque, I'm going to write a litte about
the tools, best practices and techniques I use when developing scientific data analysis software in Python.
Working in the sciences, like Astronomy in my case, one often writes
short code snippets, which are run once or twice to produce plots to
show at the next meeting but throw away the scripts afterwards. These
scripts and their use are very different from the larger software
products one might also create in the sciences. But often the small
scripts will grow into the larger projects, and then one wishes to
have started differently, with more structure, more tests and the
bigger picture in mind.
The following tools might help to
accomplish the switch from the small snippets to the larger projects
with minimal pain.
Python
Although I will talk about python itself, you should probably read some of the following:- Dive into Python
- Scientific Programming with Python
- The Numpy & Scipy tutorials
- The Matplotlib gallery examples
And if you happen to work in astronomy, you want to visit this site regularly, subscribe to the mailing list, look through the list of packages, etc.:
Small Snippets
The python shell in not very useful for most
tasks. IPython is much better and you will probably be happy with it.
But there is even something better: IPython with the notebook feature switched on!
> ipython notebook --pylab=inlineNow you should have a new tab in your browser, with the dashboard open. IPython Notebook has even the ability to provide a working environment for collaborative editing of the code, but I will not go into details about that.
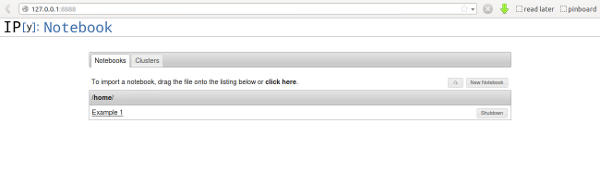 Create a new notebook or open a saved notebook to continue where you
left. In the picture you can see that I have one existing notebook
called "Example1". Selecting this opens a new tab with something looking like this:
Create a new notebook or open a saved notebook to continue where you
left. In the picture you can see that I have one existing notebook
called "Example1". Selecting this opens a new tab with something looking like this:
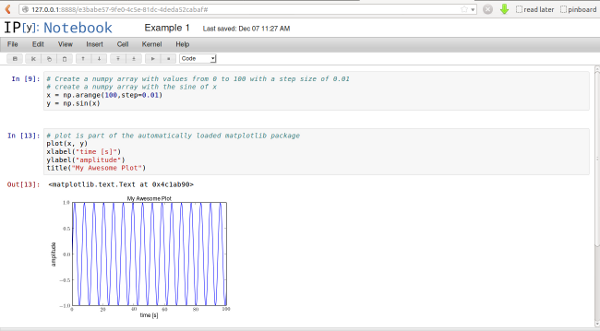 You can see on the left side, that there are connected lines of code
(called "cells"). Its a good idea to group your code a little here,
because you can run code here either in the full notebook or in
individual cells. You can also collapse cell output, helping you in
getting a better overview of your code.
You can see on the left side, that there are connected lines of code
(called "cells"). Its a good idea to group your code a little here,
because you can run code here either in the full notebook or in
individual cells. You can also collapse cell output, helping you in
getting a better overview of your code.A nice feature of the IPython Notebook are the inline plots: just call
plotor a related matplotlib call, and get an inline graphic of the output. Add labels, titles, comments and simply re-run the current cell to get an updated plot!
At some point you might want to turn these small notebooks into a real executeable program. But before you do that, start with something else: turn the logical blocks (the cells) into functions. Structuring your code is important in the long run and this is a good time to start.
Functions in python look like this:
def create_data():
    # Create a numpy array with values from 0 to 100 with a step size of 0.01
    # create a numpy array with the sine of x
    x = np.arange(100,step=0.01)
    y = np.sin(x)
    return x, y
When you are used to other programming languages, it is interesting to
note that in python a function can return more than one variable. In this
case we return two arrays. You would call such function like this:
time, amplitude = create_data()You can do the same with the plotting part.
This is a great starting point to turn your snippet into a real program. Unlike the standard python interpreter sessions, notebooks can be saved into normal python files. This example would result in code like this:
# -*- coding: utf-8 -*-
# <nbformat>3.0</nbformat>

# <codecell>

def create_data(start=0, stop=100, step=0.01):
    # Create a numpy array with values from 0 to 100 with a step size of 0.01
    # create a numpy array with the sine of x
    x = np.arange(start,stop, step)
    y = np.sin(x)
    return x, y

# <codecell>

def plot_results(x, y):
    # plot is part of the automatically loaded matplotlib package
    plot(x, y)
    xlabel("time [s]")
    ylabel("amplitude")
    title("My Awesome Plot")

# <codecell>

time, amplitude = create_data()
plot_results(time, amplitude)

# <codecell>
Python Software
You are working on Linux, right? Great!When you write software, you should follow a number of best prectices. You will likely think that you have better things to do, but in the end, these will help you safe time and frustration:
- Use version control: chose one of:
bazaar, git or mercurial.
Those are state of the art distributet version control systems. All of them are great (don't believe anyone that one of them is superior to the others, they are just slitely different...). But do not choose cvs and svn if you don't have to. - Write tests! Really! Early!
- Let your code accept standard parameters: e.g. "-h", "--help",
- Structure your code into several files, folders (in python: modules, packages)
- Prepare your code for distribution to other people.
The Quickly developers thought the same, so they wrote an app-developer tool that uses templates and shortcut commands to do this boring stuff for you:
Of couse, first you have to install quickly itself (I assume Ubuntu commands here):
> sudo apt-get install quicklyNow, create a new project. Since you will most likely not care about a GUI, choose the CLI (command line interface) template:
> quickly create ubuntu-cli loftsimulator
> cd loftsimulator
> quickly run
It's really a great start for a larger project. All the things I listed above (common arguments, testing, version control...) is taken care of!
Important steps:
- Tell the software who you are in the AUTHORS file.
- Add commandline options in the
file
loftsimulator/__init__.py
- Write tests to make sure your code works. Write the tests first,
actually, and code until the tests pass... Often you will think that a specific part of your code is not testable, because it requires user input, large amounts of data, random numbers, etc, but also most of the time it is then best to structure your code is such a way that you can test most of your code. This not only makes your test coverage better, it mostly results also in easier to understand code.
Running tests is very easy:quickly test
- Once the tests pass, run your code:
quickly run
- Happy with your code? Commit your changes to the version controlsystem:
quickly save "added a great new feature..."
- Need to share the code with other people (using ubuntu)?
quickly package
Now you can give away the newly created package loftsimulation.deb, which others can install with a simpledpkg -i loftsimulation.deb
Plotting with Python
Scientist produce plots all the time, so a plotting library is very important. In Astronomy you will likely have used IDL to do this, in VHE astronomy maybe ROOT.The great thing about scientific programming in Python is the decoupling of analysis (numpy, scipy, sympy, ...) and the graphical output (matplotlib, mayavi2, APLpy, ds9,...). This is very different from ROOT and IDL, where the scientific libraries are also the plotting libraries. The best library/software really depends on what you like and need to do.
I often use matplotlib and kapteyn, which is a nice extension to the matplotlib library with tools specifically for astronomy.
Qreator is getting ready for a second coming...
Half a year ago, I joined David Planella in the development of his nice Qreator app. From the software-center description: "Qreator is an Ubuntu app that enables you to easily create your own QR codes to encode different types of information in an efficient, compact and cool way."
In the next days we will see the "second coming" of Qreator with lots of new features and improvements:
- The new dataformat: BusinessCard
A QR code created with this datatype allows the scanning application to directly import the contact details into the address book. The format currently uses the VCard standard, but MECARD will be available in the future. - The new dataformats: SMS and Call
When scanning a barcode of this type, you will be asked if you want to send a text message to the encoded phone number or place a call. - When encoding URLs, you can directly shorten the ULR with the 'ethical shortening service' Is.gd
Other shortening services (goo.gl, bit.ly, tinyurl.com) are already implemented, but are not selectable until we have a nice solution for preferences... - QR codes now can have colors!
Pick your favorite foreground and background colors (but make sure their brightness is reasonably different...) - Printing is now also possible, as well as Drag'n'Drop
- The SoftwareCenterApp dataformat got a boost: its 10 times faster!
(at least the autocompletion feature :-)
 And of course there have been internal changes as well. They will pay off in the future...
So: head over to the software center and give it a try! We are looking for feedback...
And of course there have been internal changes as well. They will pay off in the future...
So: head over to the software center and give it a try! We are looking for feedback...
Pypy on Project Euler
Today, I ran some tests with pypy and my few Project Euler solutions:| Solution | Python 2.6.6 | PyPy 1.5 | Factor | 7 | 9.57s | 1.92s | 4.98 |
|---|---|---|---|
| 7_b | 0.52s | 0.14s | 3.71 |
| 9 | 0.51s | 0.10s | 5.1 |
| 14 | 6.70s | 6.97s | 0.96 |
| 25 | 1.25s | 0.68s | 1.83 |
Latex sucks
Maybe I should not write blog posts when I'm angry about something... but anyway:
Today was another wasted day, mostly caused by Latex. To sum it up: Although there is no real alternative to Latex, and I will therefore continue to use it in the future: IT SUCKS!
Consider the following problem:
I want no pagenumbers on all pages from the first, until after the list-of-tables.
If Latex would be sensibly designed, somthing like the following would work:
\pagestyle{empty}
\maketitle
\tableofcontents
\listoffigures
\listoftables
\pagestyle{headings}
But it doesn't! Some pages still have pagenumbers! This is what is necessary to remove ALL pagenumbers.
\usepackage{scrpage2}
[...]
\clearpage
\pagestyle{empty}
\renewcommand*{\chapterpagestyle}{empty}
\maketitle
\tableofcontents
\listoffigures
\listoftables
\addtocontents{toc}{\protect\thispagestyle{empty}}
\addtocontents{lof}{\protect\thispagestyle{empty}}
\addtocontents{lot}{\protect\thispagestyle{empty}}
\clearpage
\pagestyle{headings}
\renewcommand*{\chapterpagestyle}{plain}
And then run latex several times ...
Nokia and Microsoft
Nokia and Microsoft: "There are other mobile ecosystems. We will disrupt them."Time to say goodby to Nokia phones and "hello!" to android (and hope for Ubuntu on smartphones...)
UPDATE: well, that is a good start: Ubuntu for phones... Let's hope that some mobile manufacturor picks it up!
Maemo is dead ...
Today Nokia and Intel announced the merging of maemo and moblin to form MeeGo (TM).
While this might sound good to some, it is a bit sad for me. The first thing I'm sad of is the focus on C++ and Qt. As you might know, maemo 5, the operating system of the N900, is based on gtk and clutter.
Quote:
GTK and Clutter are also included for application compatibility.To me this sounds like: will be dropped in the next version.
I want Debian Mobile
But the biggest loss in this merge is the packet management system, which will be rpm.
Quote:
So: today I lost the urge to learn to develop software for my N900...Will MeeGo use .rpm or .deb as its packaging system?
MeeGo will use the .rpm format
Update 2010-02-16: Here is a speed comparison of Yum (rpm management system) and probably Synaptic (deb management system). Although this is NOT a comparison between deb and rpm, is still says something about available tools in each package management system.
Ady Gil rammed by whalers
The trimaran Ady Gil of the Sea Shepherd Conservation Society, formerly known asClasses as Decorators of Methods in Python
I have had some trouble to figure out how to use a class as a decorator for a method (as opposed to a decorator for a function). Here is a script that prints some useful information about what is called when and with what parameters.
#!/usr/bin/env python
print "Classes as Decorators of Methods\n"
print "-----Parsing dec"
class dec(object):
    def __init__(self, a):
        print "----- dec init"
        print type(a)
        print "decorated method: ", a.__name__
        self.a = a
    def __get__(self, inst, cls):
        print "-----dec get"
        self._inst = inst
        self._cls = cls
        return self
    def __call__(self, p):
        print "-----dec call"
        print type(self)
        print type(self._inst)
        print type(self._cls)
        return self.a(self._inst, p.upper())

print "-----Parsing C"
class C(object):
    def __init__(self):
        self.X = "Hello"
    @dec
    def run(self, p):
        print p,
        print self.X,
        return "world"

if __name__ == "__main__":
    print "-----Object creation"
    c = C()
    print "-----Object method call"
    print c.run("This is a decorator ")
This produces the following output:
Classes as Decorators of Methods
-----Parsing dec
-----Parsing C
----- dec init
type 'function'
decorated method: run
-----Object creation
-----Object method call
-----dec get
-----dec call
class '__main__.dec'
class '__main__.C'
type 'type'
THIS IS A DECORATOR Hello world
In contrast: functions as decorators for functions
#!/usr/bin/env python

print "--- Parsing dec"
def dec(f):
    print "--- Run dec"
    print f.__defaults__
    def x(*args, **kwargs):
        print "--- Run x"
        print f.__name__
        print args
        print kwargs
        f(*args, **kwargs)
    return x

print "--- Parsing foo"
@dec
def foo(a, b=3):
    print "--- Run foo"
    print a, b


print "--- Calling foo"
foo(1)
print "--- Calling foo"
foo(2, 4)
Which outputs:--- Parsing dec
--- Parsing foo
--- Run dec
(3,)
--- Calling foo
--- Run x
foo
(1,)
{}
--- Run foo
1 3
--- Calling foo
--- Run x
foo
(2, 4)
{}
--- Run foo
2 4
 .
. Spend the day fiddling around with ROOT
Read this, if you think that using ROOT and C++ for scientific analysis is a good idea!If you start with scientific data analysis or if you are looking for a framework to build the software of your next-generation experiment: scipy/numpy seems like a good idea!
But please don't use ROOT. Please...
Django Internationalization
UDPATE: please check the djangoproject, because the situation is much better now...Today I realized that the django way of internationalization is not as good as I had thought. Here are two areas where it could be improved:
The models
Django has no default way of translating fields in models. This is a known shortcoming and was addressed in many plugins (transdb, transmeta, multilingual, multilingual-model, translate, ...) and in a Google Summer of Code project by Marc Garcia.
As I see it, the translation of any kind of data should not be in a seperate table or in a metaclass. Why? Because translation should not be the way to think in the first place. If you have a piece of information that is not universally understandable (like an photograph), than you can assign a language or culture to that information. If your site should be available in several languages, then there is no good reason why one language should be superior (and allowed in the model), while other languages are inferior (and have to go into a translation table). So there is no translation of a first, superior string but there is a piece of information in different, equally important languages.
So, with regard to this poll, the only good option would be to state "this field is language specific" and django should create a field for every supported language (mainly like multilingual-model).
The admin interface should display these fields and a bonus would be to be able to create a report based on the missing translation fields.
The urls
But there are other fields where internationalization is also important and where I couldn't find any plugins or snippets. It's the url resolution. Your apps should have human-readable urls that don't change over time. Suppose you have this url in your shop: "/smartphone/linux/N900" and suppose that "smartphone" is a category that was not planned when the shop was planned but rather entered in the admin as a (translatable) categorization of a specific phone. Now if you want to make this translatable, you have to create a pattern like
"(?P
but how is that supposed to be distinguished from
"(?P
if these things should also be translatable? So the point is: the regular expressions in the url resolution mechanism are not translatable (if the strings are dynamical db content).
What could be done?
The could be an url manager that can receive signals about a change in the urls patterns. And there should be an attribute (db-field, function, ...) in every model or view which can take translatable fields as parameters and create and update the corresponding urlpatterns.
A FITS thumbnailer for Thunar
If you work in Astronomy, you will likely have a lot of fits files lying around. Although the FITS format is absolutely not an image-only format, I would still like to see a preview in my filemanager if there is an image encoded in the file. The standard thumbnailers for Xubuntu don't do this, so here is how to create your own:- create a desktop file that describes, what your thumbnailer does:
/usr/share/thumbnailers/fits-thumbnailer.desktop[Desktop Entry] Version=1.0 Encoding=UTF-8 Type=X-Thumbnailer Name=FITS Thumbnailer MimeType=image/x-fits;image/fits;application/fits; X-Thumbnailer-Exec=python /usr/lib/thunar-thumbnailers/fits-thumbnailer.py %i %o %s
- create the thumbnailer script under:
/usr/lib/thunar-thumbnailers/fits-thumbnailer.py#!/usr/bin/env python import pyfits import matplotlib.pyplot as plt import sys try: infile = sys.argv[1] outfile = sys.argv[2] except: exit(1) try: size = sys.argv[3] except: size = 256 hdul = pyfits.open(infile) data = None # Is the primary HeaderDataUnit an image with data? if (hdul[0].header["NAXIS"] != 0): data = hdul[0].data else: # The primary had no data, so we search for the first image! for hdu in hdul[1:]: if (hdu.header["XTENSION"] == "IMAGE"): data = hdu.data break if data != None: plt.imshow(data) plt.savefig(outfile, transparent=False, format="png") - regenerate the thumbnailer cache:
/usr/lib/thunar/thunar-vfs-update-thumbnailers-cache-1
See it in action:
There are actually a lot of cases, where this will not work, it will not take WCS into account and is in general not very sophisticated, but it works for me (TM). For more information about Thunar thumbnailers see:
Customizing Thunar
Additional thunar thumbnailers
Freedesktop thumbnailer spezification
Freedesktop desktop-entry spezification
Eee PC 901 go: Nice hardware, bad software
Yesterday I got my new Eee PC 901 go with 16GB ssd harddrive and Linux. The battery lifetime is great, the hardware in general is really nice.But the software really really sucks. I have no idea why Asus is doing this (actually, I have an idea).
Ok, so what is the problem with that software thing on the Eee PC?
The first impression is that they tried their best to make it look like XP. This IS annoying. With all the innovation that they could have made, they chose to imitate the one system that Linux users don't want to see. The second impression is that the software I want is not there, that updates are missing (2009/06 and still Firefox 2.0 ????) and that the only configuration Asus wants you to do is changing the background color. One thing to note is that the screen is really small and a small window theme (icewm is used along with kde and gnome applications) would be good. Instead a big theme is used along with a big cursor and big fonts. There are signs of a full desktop mode (a start script, tutorials on the internet), but the Asus homepage states very clearly: Only one desktop mode is available.
So I guess that I will investigate further, if eeebuntu isn't much better. And the next time I will try to buy at system76 , if they start to deliver to Germany ...
Note to self: Latex and Labels
In a Latex figure environment, the \label command has to follow the \caption command. Otherwise referencing the figure will result in the section number (where the figure appeared) to be printed. Sometimes Latex is not very user friendly...
    \begin{figure}[!th]
    \centering
    \includegraphics[width=2.5in]{some_filename}
    \caption{some caption}
    \label{fig:some_image}
    \end{figure}
Emacs as a latex environment
I use the AUCTex mode in Emacs, which has lots of useful features. Here is a mix of commands and additions that help me improve the Emacs-Latex experience:RefTex (actually you will already use this if you use AUCTex mode), Greek Emacs input, PDFSync and Orgmode tables.
RefTex
There is much to say about reftex But I'll just show the two commands that I use regularly:C-c =This will open a buffer where you can navigate through your document's toc.
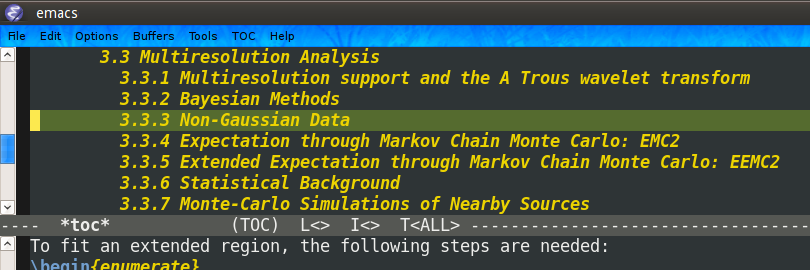
This comes very handy for large projects like PhD thesis :-). With python I use something like outline mode for roughly the same purpose, but this is perfect for my latex documents.
The other shortcut I use is:
C-c [This command will ask you for your citation style
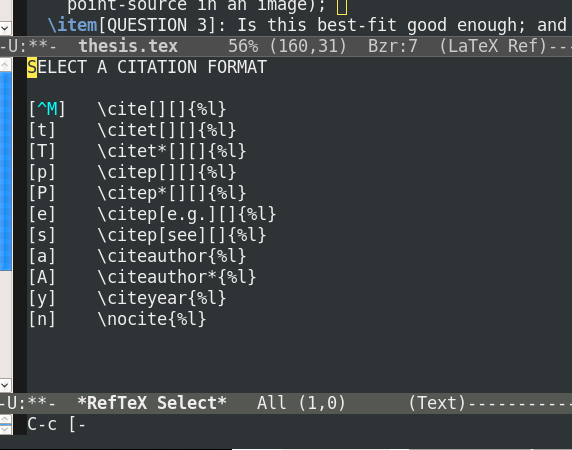
and for a regulare expression for searching your bibtex file to find the reference.
Then you can navigate through the matching references and choose the one that you want.
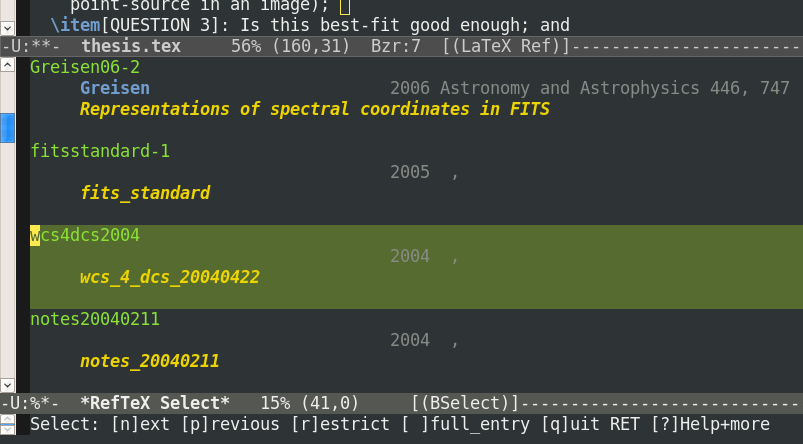
With a single bibtex file containing about 1000 references this feature is very handy.
Xelatex for greek input
If you are using texlive / xetex, then you have full utf-8 support built-in. Now you need a way to use it :-) If you write in a language other then english, you probably already use this feature. Just typing
äöüß
instead of
\"a\"o\"u\ss{}
is already good. But being able to also type:
$αβγ = 3μm$
instead of
$\alpha\beta\gamma = 3\mum$
is really a good thing, both for readability and for typing speed.
Update: actually it's not that simple. But it got simpler with TexLive 2009. I have something like this in the preamble of my documents:
    \usepackage{mathspec}
    \setmainfont[Mapping=tex-text]{CMU Serif}
    \setsansfont[Mapping=tex-text]{CMU Sans Serif}
    \setmathsfont(Greek,Latin){CMU Serif}
    \setmathsfont(Digits){Neo Euler}
To insert greek characters in emacs, just type:
C-\ greek RET
From then on, the
C-\
will switch between greek input and your normal input.
PDFSync
Sometimes in larger documents, you want to jump directly from a line in your latex file to the corresponding line in the pdf file. With pdfsync and xpdf, this is possible (note that with TexShop the other way is also possible, but not with emacs at the moment). In you Latex file, insert the following:
\usepackage{pdfsync}
Now just type:
C-c C-v
and the line will be displayed in xpdf. Nice.
OrgMode Tables
The Emacs Org mode is a great mode for table editing (and other things). The table editing mode can be called separate from the complete Org mode, which is a great tool for example for Latex, where the table editing is something very unpleasant! The following work flow helps a lot, but check out the full example here for more advanced options: OrgMode ManualLet's start with a Latex file with the comment package (the org mode table is within a comment environment, so your latex does not get messed up!):
    \documentclass{article}
    \usepackage{comment}
    \begin{document}
    Hallo!\\
    \end{document}
Then type:
    M-x orgtbl-mode
    M-x orgtbl-insert-radio-table
This will ask you for a table name, let's say: atesttable
Now the document looks like this:
    \documentclass{article}
    \usepackage{comment}
    \begin{document}
    Hallo!\\
    % BEGIN RECEIVE ORGTBL atesttable
    % END RECEIVE ORGTBL atesttable
    \begin{comment}
    #+ORGTBL: SEND atesttable orgtbl-to-latex :splice nil :skip 0
    | | |
    \end{comment}
    \end{document}
And then you can change the table using the great OrgMode capabilities!
Once you have done this, type
C-c C-c
This will update the latex table to something like this:
    \documentclass{article}
    \usepackage{comment}
    \begin{document}
    Hallo!\\
    % BEGIN RECEIVE ORGTBL atesttable
    \begin{tabular}{rll}
    Times [sec] & Names & something else \\
    \hline
    3 & John & hi \\
    4 & Elisa & ho \\
    5 & Nobody & hiho \\
     &  &  \\
    \end{tabular}
    % END RECEIVE ORGTBL atesttable
    \begin{comment}
    #+ORGTBL: SEND atesttable orgtbl-to-latex :splice nil :skip 0
    | Times [sec] | Names  | something else |
    |-------------+--------+----------------|
    |           3 | John   | hi             |
    |           4 | Elisa  | ho             |
    |           5 | Nobody | hiho           |
    |             |        |                |
    \end{comment}
    \end{document}
That's it. My current setup and usage of Emacs as a Latex IDE.
OpenOffice
Why do I even try to used it again and again?OpenOffice 3 crashed for the third time today. I really should have made that presentation with Latex-Beamer!
Oh and by the way: If I write μController I don't mean Mcontroller, AutoCorrect seems to think different...

Precision of float calculations
Given that a and b are positive, the calculation:
But is this true in computer languages?
a:1.2345678e-30
b:5.5889944e-28
The real result is: 6.89999252062032 e-58
What do the following programs tell me?
C
#include <math.h>
#include <stdio.h>

int main(){
  double a = 1.2345678e-30;
  double b = 5.5889944e-28;
  double c, d;

  c = a * b;
  d = exp(log(a)+log(b));

  printf("a * b =                %.20e \n", c);
  printf("exp(log(a) + log(b)) = %.20e \n", d);
  return 0;
};
output:
a * b =                6.89999252062031977189e-58

exp(log(a) + log(b)) = 6.89999252062023345995e-58
The real result is: 6.89999252062032Python
import math
a = 1.2345678e-30
b = 5.5889944e-28
print "----------math----------"
print "a * b =                %s" % repr(a*b)
print "exp(log(a) + log(b)) = %s" % repr(math.exp(math.log(a)+math.log(b)))


import mpmath
mpmath.mp.dps = 20
a = mpmath.mpf(1.2345678e-30)
b = mpmath.mpf(5.5889944e-28)
print "---------mpmath---------"
print "a * b =                %s" % repr(a*b)
print "exp(log(a) + log(b)) = %s" % repr(mpmath.exp(mpmath.log(a)+mpmath.log(b)))
----------math----------

a * b =                6.8999925206203198e-58

exp(log(a) + log(b)) = 6.8999925206202335e-58

---------mpmath---------

a * b =                mpf('6.8999925206203201922352e-58')

exp(log(a) + log(b)) = mpf('6.8999925206203201919869e-58')
The real result is: 6.89999252062032Scheme
(define y 0.00000000000000000000000000055889944)
(* x y)
(exp (+ (log x) (log y)))
output:
6.89999252062032e-58

6.899992520620233e-58
R
6.899992520620233e-58
gcalctool
Not exactly a language, but interesting: the result is 6.89999252062032e-58 for a*b.Note, that the standard windows calculator also prints the exact result.
So what is the result:
| Language | Results |
|---|---|
| c: |
6.89999252062031977189 e-58 6.89999252062023345995 e-58 |
| python (math): |
6.8999925206203198 e-58 6.8999925206202335 e-58 |
| python (mpmath): | 6.8999925206203201922352 e-58 6.8999925206203201919869 e-58 |
| scheme: |
6.89999252062032 e-58 6.899992520620233 e-58 |
| R |
6.89999252062032e-58 6.899992520620233e-58 |
| gcalculator and windows calculator: | 6.89999252062032 e-58 |
| the real result: | 6.89999252062032 e-58 |
Xfce 4.6 released
You might have read it already, but today the Xfce team released Xfce 4.6!Congratulation to the developers.
Take a look at the new features here: Tour
Scientific python packages
I use these packages regularly:- python 2.5 (http://www.python.org)
- numpy (http://www.scipy.org/Download)
- scipy (http://www.scipy.org/Download)
- matplotlib (http://sourceforge.net/projects/matplotlib)
- pyfits (http://www.stsci.edu/resources/software_hardware/pyfits/Download)
- kapteyn (http://www.astro.rug.nl/software/kapteyn/)
- mayavi2 ( http://code.enthought.com/projects/mayavi/docs/development/html/mayavi/installation.html)
- python-sao (http://code.google.com/p/python-sao/)
- pymc (http://code.google.com/p/pymc/)
To be done... part 2: Meta-information
My Problem:
I have a lot of unsorted scientific papers! Their filenames don't resemble their titles and they are stored in a bunch of places. I tend to download them as I search the internet for papers that help me with a problem and sometimes I even DownThemAll.
Weeks, month later, I try to find the *one paper* that was so interesting and cite it via BibTex in my Latex file. But I can't remember the filename, title, author, year or journal (in any combination).
Or I see a paper, know that I read it, but can't remember if it was that good...
Possible Solution:
Using a search engine (Tracker), a bibliography manager (Referencer) and a file manager (Thunar).
With Thunar, I can mark files as interesting.
With Tracker I can search the text of a document and tag it.
With Referencer I can tag a paper and export the meta-information to a Bibtex file.
Why I'm still unhappy:
It seems that Tracker, Referencer and Thunar don't use the same location to store meta-information about the documents. They all seem to use different databases.
I would have to write a plugin for two of them to get the three of them working together.
Not good.
Using numdisplay
Numdisplay is one of the cool python astronomy packages that lack documentation! What I want to do is display an image from the python shell (easy and well documented) and this image shall contain WCS information, because otherwise I could as well use matplotlib (really hard and NOT documented).What I know so far:
- open ds9 with the following command:
ds9 -unix "/tmp/.IMT3"
- in the python shell create an UnixImageDisplay
uid = numdisplay.displaydev.UnixImageDisplay("/tmp/.IMT3") - don't really know how to continue ... the wcs stuff seems not to work the way I expect ...
Next try, this time with python-sao:
import pysao
ds9 = pysao.ds9()
ds9.view(hdul[6])
Much better :-)
Python, Astronomy and Maps
Update: the solution is here: KapteynUpdate 2: there is also a new package that I have not tested, but that seems to be good: APLpy
Update 3: and now there is also: pywcsgrid2
You might want to look at the following site for more up to date information: astropython
Python is a good language for scientists. It basically replaces proprietary software like IDL, Matlab or SAS. What it lacks at the moment is an easy way to display astronomical data saved as fits files containing WCS information.
WCS information standardizes the transformation between pixel coordinates and world coordinates (e.g. position in the sky). There is a good library, pywcs, that deals with this information.
Matplotlib, a good choice for plotting data with python, includes Basemap, a toolkit to display maps (of the earth) in various projections. What is missing is a link between these two!
| Basemap name | FITS Code [WCS] | Names |
|---|---|---|
| AZP | Zenithal perspective | |
| SZP | Slant zenithal perspective | |
| Gnomonic Projection | TAN | Gnomonic |
| Stereographic Projection | STG | Stereographic |
| SIN | Slant orthographic | |
| ARC | Zenithal equidistant | |
| ZPN | Zenithal polynomial | |
| Lambert Azimuthal Equal Area Projection | ZEA | Zenithal equal area |
| AIR | Airy | |
| CYP | Cylindrical perspective | |
| CEA | Cylindrical equal area | |
| Cassini Projection | CAR transverse case | |
| CAR | Plate carree | |
| Miller Cylindrical Projection | CAR with unequal scaling | |
| Mercator Projection | MER | Mercator |
| Transverse Mercator Projection | MER transverse case | |
| Oblique Mercator Projection | ||
| Equidistant Cylindrical Projection | ||
| Sinusoidal Projection | SFL | Sanson-Flamsteed |
| PAR | Parabolic | |
| Mollweide Projection | MOL | Mollweide |
| AIT | Hammer-Aitoff | |
| COP | Conic perspective | |
| Albers Equal Area Projection | COE | Conic equal-area |
| Equidistant Conic Projection | COD | Conic equidistant |
| COO | Comic orthomorphic | |
| Lambert Conformal Projection for sperical earth = COO | ||
| BON | Bonne's equal area | |
| Polyconic Projection | PCO | Polyconic |
| TSC | Tangential Sperical Cube | |
| CSC | COBE Quadrilateralized Spherical Cube | |
| QSC | Quadrilateralized Spherical Cube | |
| Azimuthal Equidistant Projection | ||
| Orthographic Projection | ||
| Geostationary Projection | ||
| Robinson Projection | ||
| Gall Stereographic Projection | ||
| Polar Stereographic Projection | ||
| Polar Lambert Azimuthal Projection | ||
| Polar Azimuthal Equidistant Projection | ||
| McBryde-Thomas Flat Polar Quartic | ||
| van der Grinten Projection |
This is my first post
I wanted to switch from blogger to my own blogging software.The main reason for this was that I wanted to do more with django and building my own blogging solution seemed to be a good start. I looked into pinax blog app and copied most part from there... And it seems to work!
What is missing:
comments- a cool admin interface (is it possible to include an emacs-nox into a django admin interface? that would be interesting...)
- file upload with automatic reference from within the blog post. Something like "attachment[1]"
To be done ... part 1: PDF Annotations
Sometimes I think that there are so many problems to fix on the free desktop...
Today: PDF Annotation!
The PDF specification includes annotations, with position, color, text, highlighting, whatever.
This is a really useful feature, because I think that PDFs are an excellent way to share documents with other people, who are often supposed to make some corrections on that document (and no one wants to share whole latex directories...).
So if you work in a Microsoft environment, you are allowed to buy Adobe Acrobat. If you work on Mac OSX, you can use "preview" to annotate PDFs (in a very intuitive way). But if you work on GNU/Linux there are no good programs to do that.
Sure, there are a lot of programs, that you can use to do something very close to that, but thats not enough!
- PDFedit: the interface is not very friendly. There is no back/undo button. There is no way to highlight just a word, strike through just a word. Make a box and add some text outside the page borders. AND I DONT NEED 10 colors for my pencil. 3 colors would be more then enough!
- OpenOffice 3: The fonts are broken. Every time. If I can't read the PDF, I can't annotate it. And others won't be able to read my annotations. (And I don't even know, if annotations would be possible in OpenOffice...
- Inkscape: Fonts are broken too. Only one page is open at a time. NO WAY.
- Xournal: Close, but ... A simple box to write some text would be cool. Text highlighting as well. I know that it's not possible if the page is only loaded as an image, but that's what I would need.
- Evince: well, there will be Annotation support at some time in the future, ... (hopefully).
Meld
Today I "discovered" Meld.Meld is a tool to compare two files or directories, just like diff, but it has a really cool interface.
Here are some screenshots:
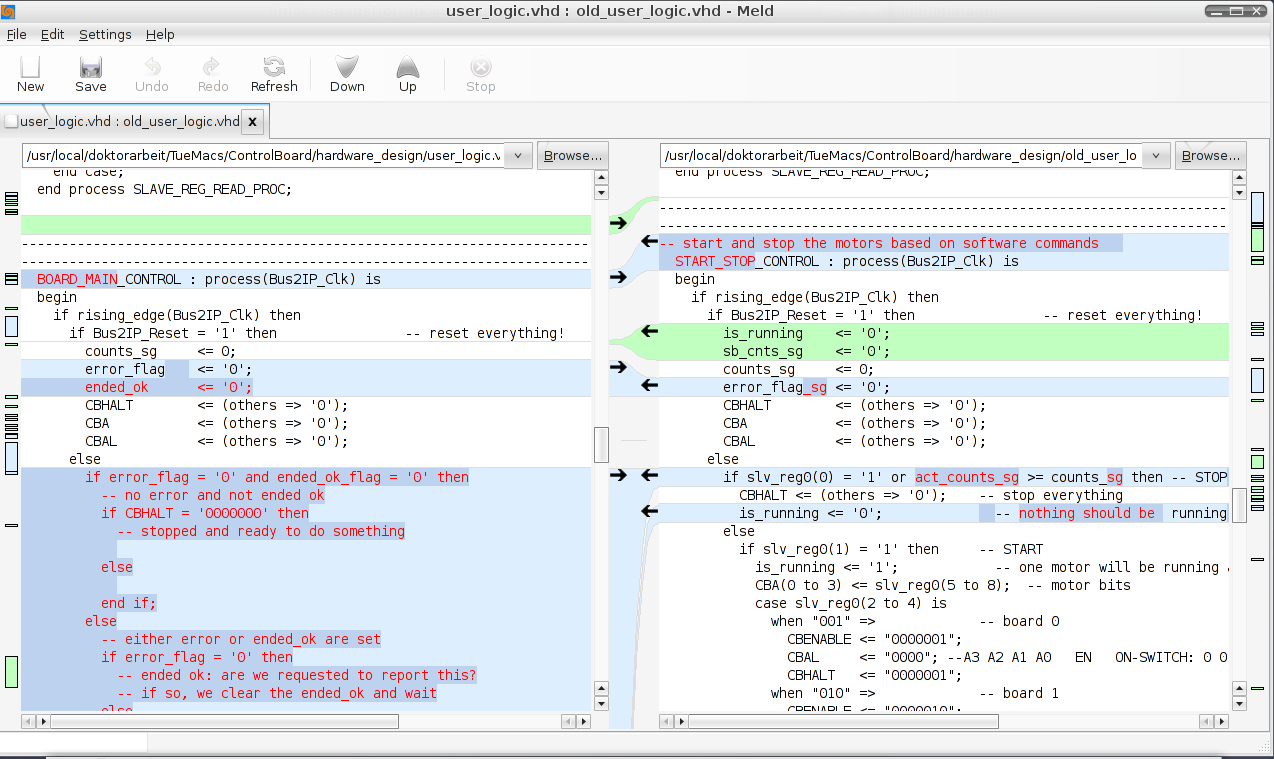
And after scrolling a bit down:
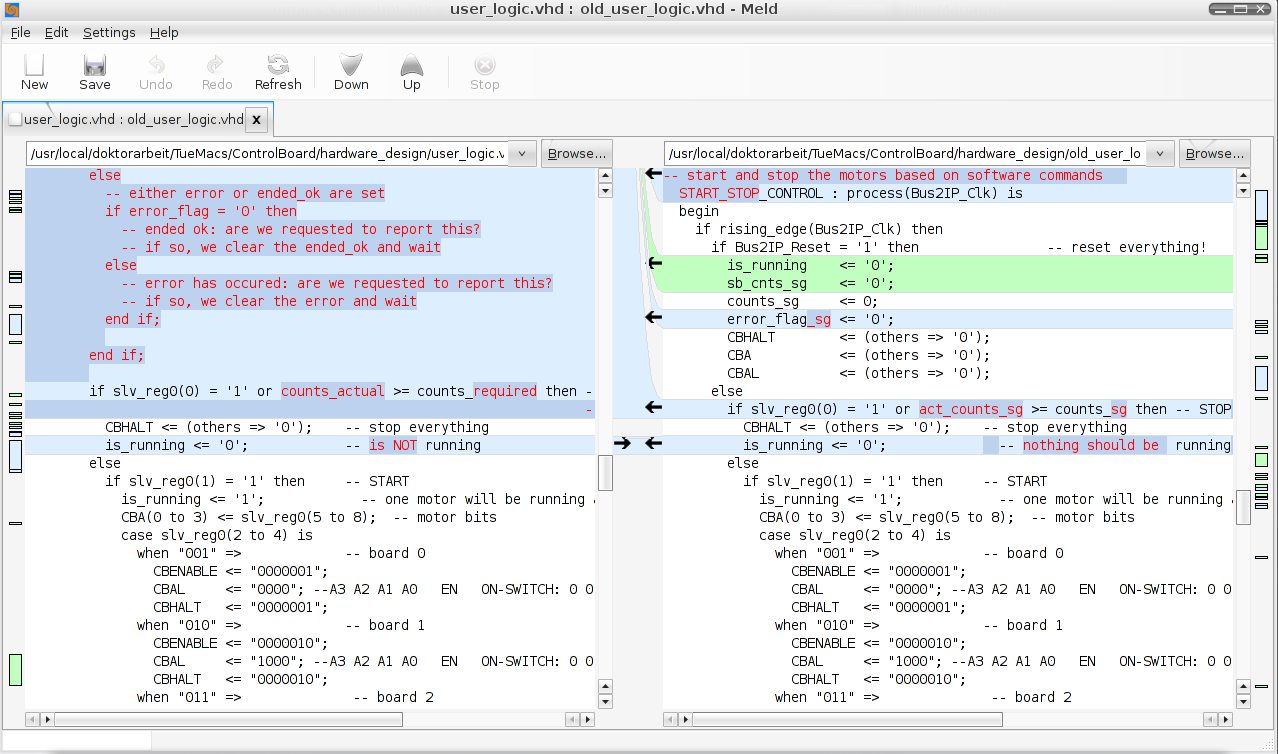
Wow. That's how I like a visual diff to appear. Both files are scrolled simultaniously, but in a way that takes care of the different file sizes. So you can always see the corresponding lines side by side.
And yes the arrows are for melding the differences from one file to the other.
This is really a tool that adds some value by using a good graphical interface.